RSG — The #2 US waste operator, 18% ROE, $2.6B FCF, and a Moody's A3 upgrade — at fair-value P/E with peer-group-low EV/EBITDA
Republic Services (NYSE: RSG) cleared all three screening gates for June 21, 2026: ROE of 17.11% / 18.62% / 18.30% for FY2023–FY2025, free cash flow positive in every period ($1.99B → $2.08B → $2.41B → $2.59B TTM), and a trailing P/E of 29.40× roughly at its own five-year average. The valuation gate is borderline — not a deep discount — but the EV/EBITDA of 14.83× sits at the low end of the waste-sector peer group, the highest ROE among listed peers (18.12% vs. Waste Connections' 13.12%), and a 4.11% FCF yield that funds $750M in dividends plus $1.1B in buybacks annually. The second Environmental Services pick in two days, differentiated from WM by lower leverage (D/E 1.11× vs. 2.28×), Moody's A3 credit (upgraded April 2025), and a distinct three-segment structure. Q2 2026 earnings expected late July.

Why RSG passed the screen today
| Criterion | RSG result | Pass? |
|---|---|---|
| ROE > 15% — FY2023 | 17.11% 3 | ✅ |
| ROE > 15% — FY2024 | 18.62% 3 | ✅ |
| ROE > 15% — FY2025 | 18.30% 3 | ✅ |
| FCF positive — all three years | $1.99B / $2.08B / $2.41B, TTM $2.59B 4 | ✅ |
| Valuation reasonable | Trailing P/E 29.40× near 5-yr avg ~30×; lowest EV/EBITDA among listed waste peers at 14.83× 1 | ⚠️ BORDERLINE |
A note on sector overlap with June 19's WM pick
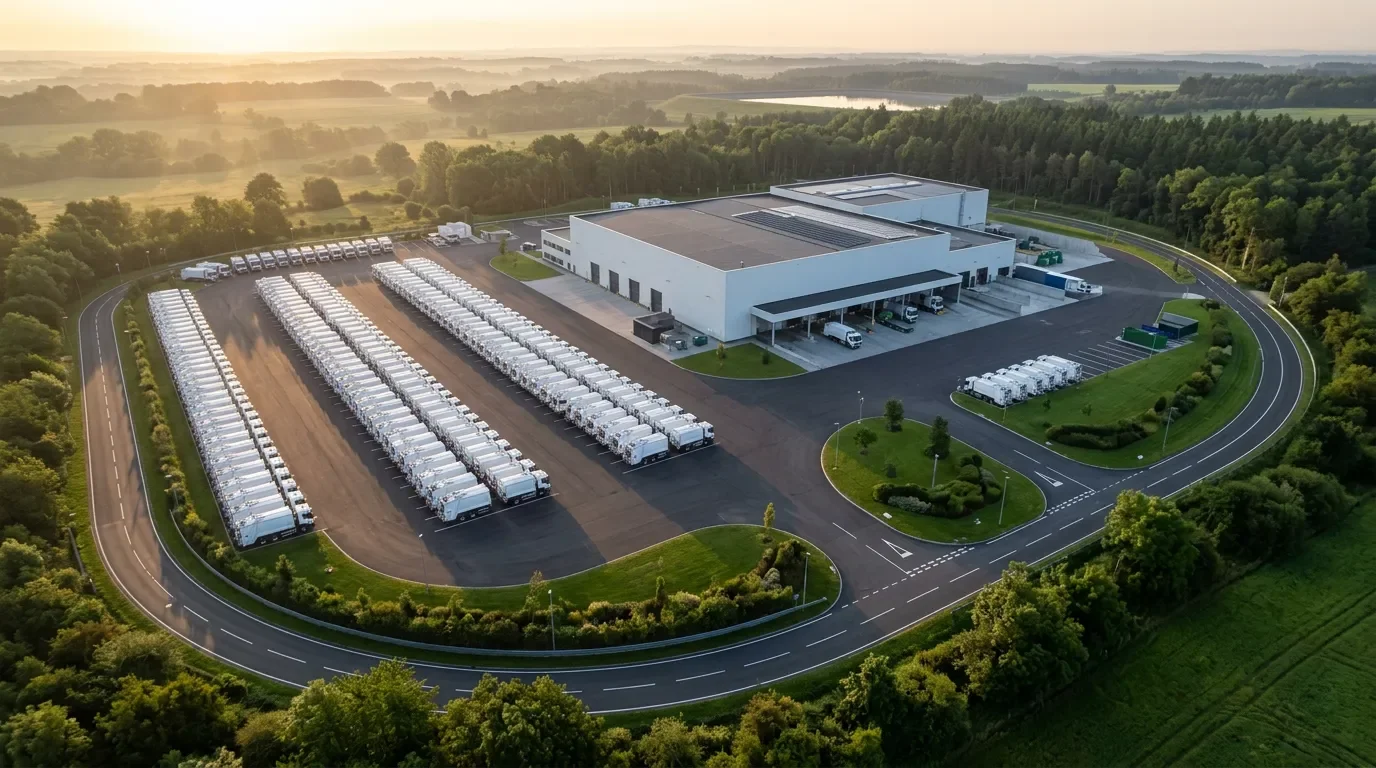
What Republic Services actually does
ROE: three years of consistent 17–19%
Free cash flow: $2.59B TTM, 5-year CAGR ~12%
| Period | Operating CF | CapEx | FCF | FCF margin |
|---|---|---|---|---|
| FY2021 | $2,787M | -$1,316M | $1,470M | 13.0% |
| FY2022 | $3,190M | -$1,454M | $1,736M | 12.9% |
| FY2023 | $3,618M | -$1,631M | $1,987M | 13.3% |
| FY2024 | $3,936M | -$1,855M | $2,081M | 13.0% |
| FY2025 | $4,296M | -$1,887M | $2,409M | 14.5% |
| TTM (Mar 31, 2026) | $4,498M | -$1,904M | $2,594M | 15.5% |
Valuation: P/E near fair value, EV/EBITDA cheapest among listed peers
vs. RSG's own five-year history
| Year | Trailing P/E |
|---|---|
| FY2021 | ~34.5× |
| FY2022 | ~27.5× |
| FY2023 | ~30.2× |
| FY2024 | ~31.0× |
| FY2025 | ~30.9× |
| 5-year avg | ~30.8× |
| Current (Jun 18, 2026) | 29.40× |
vs. listed waste peers
| Company | Trailing P/E | Forward P/E | EV/EBITDA | FCF yield | ROE (TTM) | Operating margin |
|---|---|---|---|---|---|---|
| RSG | 29.40× | 27.49× | 14.83× | 4.11% | 18.12% | 19.93% |
| Waste Connections (WCN) | 37.54× | 27.37× | 15.77× | 2.91% | 13.12% | 18.88% |
| GFL Environmental (GFL) | 107.68× | — | 15.65× | 0.55% | 2.99% | 6.40% |
| Casella Waste Systems (CWST) | 774.68× | — | 16.36× | 1.85% | 0.46% | 4.94% |
Revenue and earnings: five-year CAGR of ~8%, margin expansion intact
| Period | Revenue | YoY | Net income | Diluted EPS | EBITDA margin | Net margin |
|---|---|---|---|---|---|---|
| FY2021 | $11,304M | — | $1,292M | $4.04 | 29.6% | 11.4% |
| FY2022 | $13,509M | +19.6% | $1,488M | $4.69 | 28.4% | 11.0% |
| FY2023 | $14,974M | +10.8% | $1,731M | $5.47 | 29.3% | 11.6% |
| FY2024 | $16,033M | +7.1% | $2,044M | $6.49 | 31.1% | 12.8% |
| FY2025 | $16,586M | +3.5% | $2,139M | $6.85 | 31.5% | 12.9% |
| TTM | $16,700M | +3.2% | $2,170M | $6.97 | 31.7% | 13.0% |
Balance sheet: $13.9B debt, investment-grade across all three agencies
| Metric | TTM (Mar 31, 2026) |
|---|---|
| Total debt | $13,855M |
| Debt/Equity | 1.11× |
| Net Debt/EBITDA | 2.60× |
| Interest coverage | 5.72× |
| Cash | $118M |
| Current ratio | 0.67× |
| Altman Z-Score | 3.12 (safe zone) |
| Tangible book value | -$5.59B (goodwill $16.93B) |
| Credit ratings | Moody's A3 / S&P BBB+ / Fitch A− |
Competitive positioning and moat
- Landfill ownership (~200 active sites): Permits take years to obtain — sometimes decades — and new landfill siting faces intense regulatory and community opposition. RSG's existing permitted airspace is a finite, non-replicable asset.
- Route density and transfer network: RSG operates as #1 or #2 in most served markets. Dense routing reduces per-ton collection cost; the ~240 transfer stations anchor waste flow into owned disposal.
- Long-term municipal contracts: Five to ten-year terms with CPI escalators provide inflation protection and highly predictable revenue — roughly the same durability as a utility franchise.
- Vertical integration (60–70% internalization rate): Internalizing disposal avoids third-party tipping fees and is a direct margin lever unavailable to regional competitors without landfill ownership.
Risk factors
Near-term catalysts
Decision framework
References
- 1Republic Services (RSG) Statistics & Valuation — StockAnalysis
- 2RSG — Republic Services Inc Stock Quote — Finviz
- 3Republic Services (RSG) Financial Ratios — StockAnalysis
- 4Republic Services (RSG) Cash Flow Statement — StockAnalysis
- 5SEC EDGAR XBRL Company Facts — Republic Services (CIK 0001060391)
- 6Waste Connections (WCN) Statistics & Valuation — StockAnalysis
- 7GFL Environmental (GFL) Statistics & Valuation — StockAnalysis
- 8Casella Waste Systems (CWST) Statistics & Valuation — StockAnalysis
- 9Republic Services (RSG) Financials & Income Statement — StockAnalysis
- 10Republic Services, Inc. (RSG) Business & Moat Analysis — KoalaGains
- 11RSG Market Share vs Competitors — CSIMarket Q1 2026
- 12Republic Services PE Ratio 2012–2026 — Macrotrends
- 13Republic Services (RSG) Balance Sheet — StockAnalysis
- 14Republic Services sees rating upgrade by Moody's to A3 — Investing.com
- 15Wide-Moat Republic Services Is on Track for Record Profits in 2025 — Morningstar
- 16Republic Services Parent Company Summary — Violation Tracker (Good Jobs First)
Add more perspectives or context around this Post.